Back to Prompts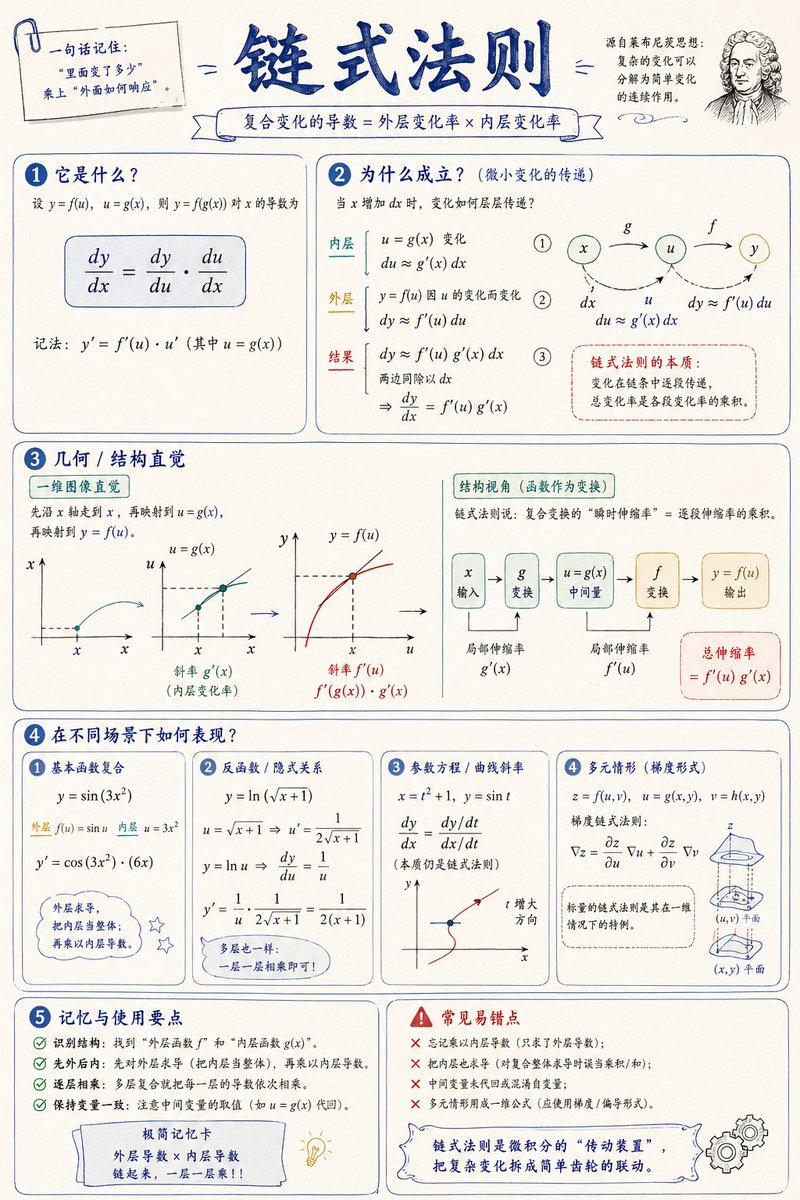
Mathematical Concept Visualization Infographic
Generates elegant, academic infographics for mathematical concepts, explaining their essence, intuition, and application. Features a clean, light-colored background with specific color accents and structured elements like cards and arrows.
Prompt
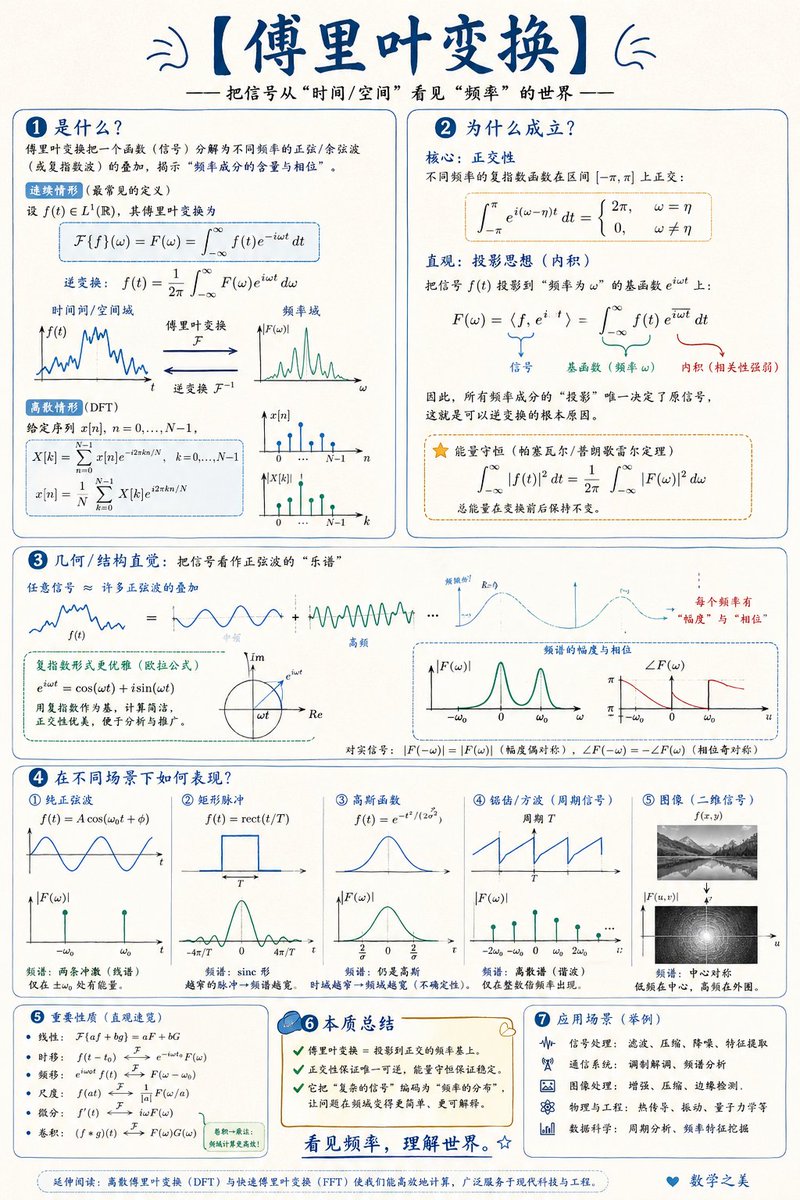
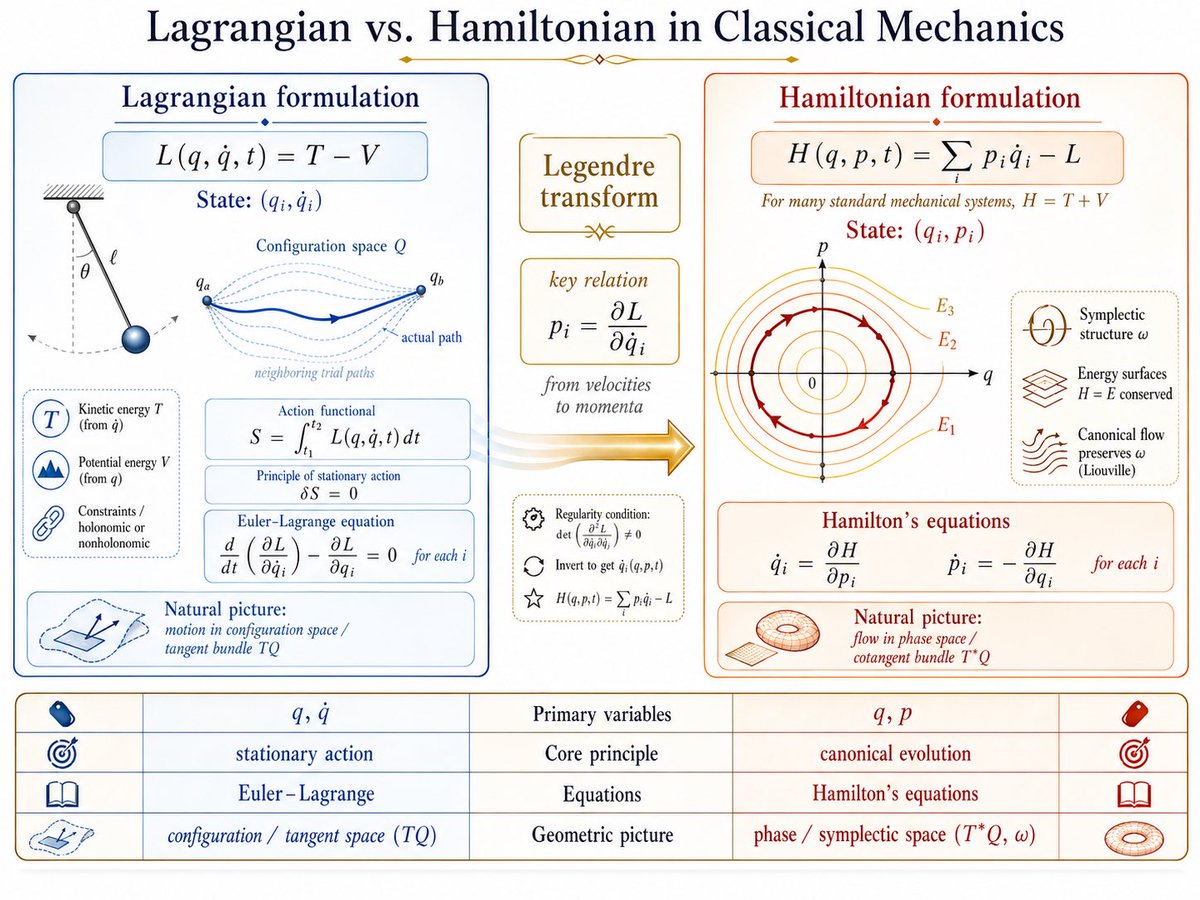
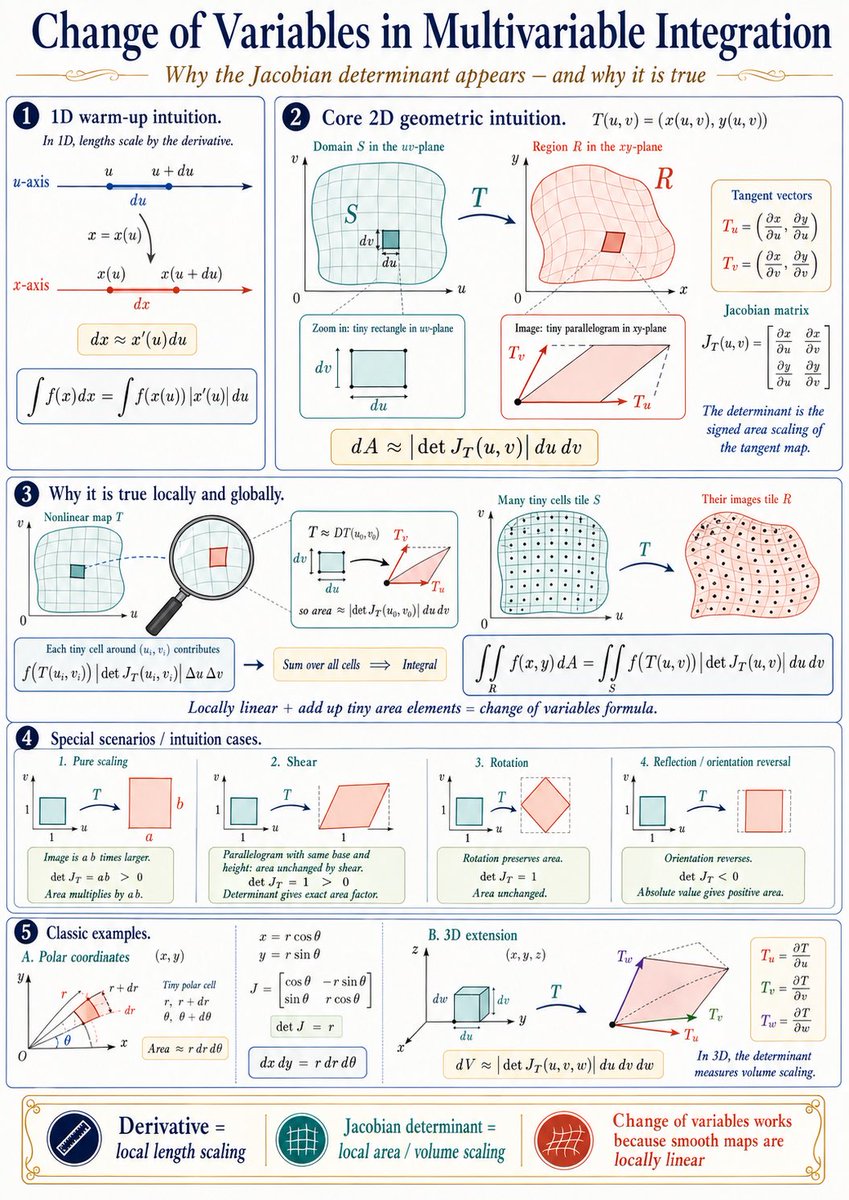
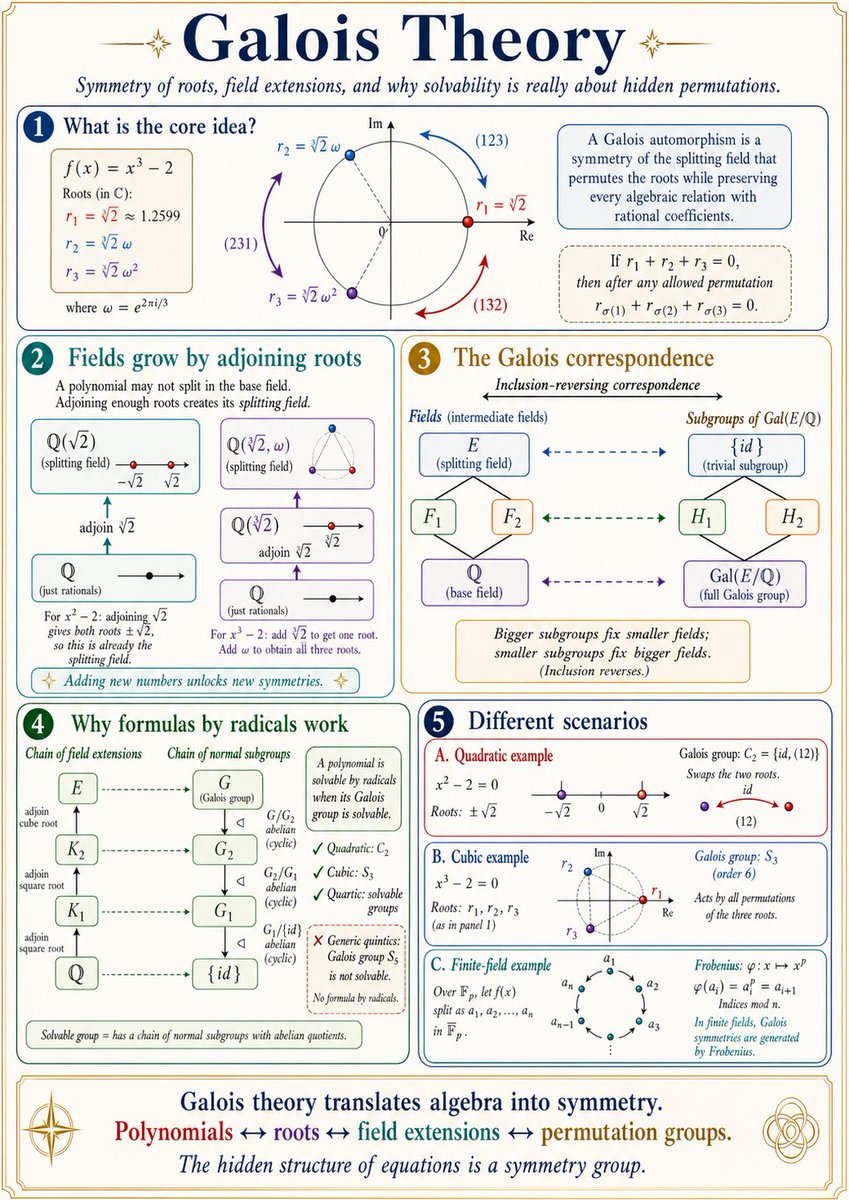
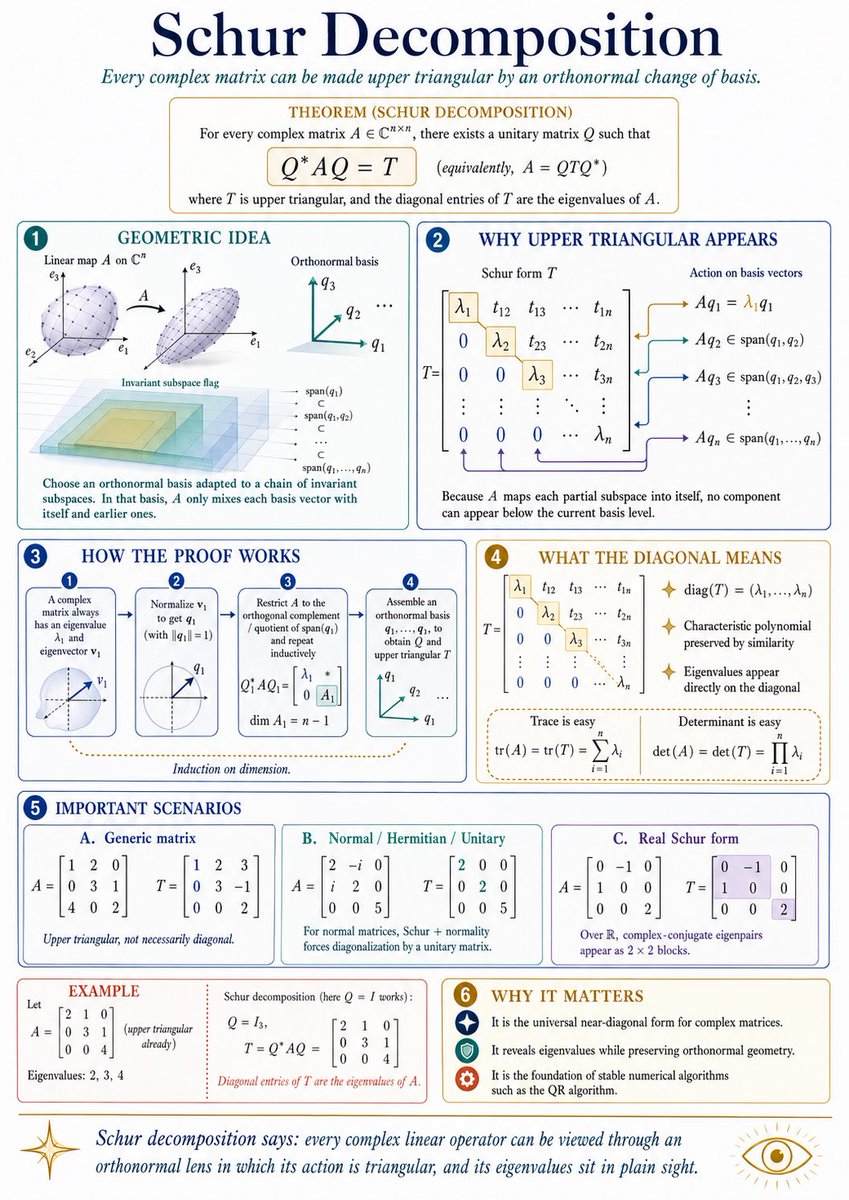
Please create a mathematical visualization infographic about "[Mathematical Concept]", aiming to help readers intuitively understand: what it is, why it holds true, its geometric/structural intuition, and how it behaves in different scenarios. The image should resemble a high-quality math lecture handout + a hand-drawn educational poster, elegant, clear, and information-rich, but not cluttered.
Visual style: Can be portrait or landscape, with a clean light-colored paper background, dark blue titles, black/dark gray body text lines, accented with a few elegant blue, cyan, gold, and red highlight colors. Use rounded cards, thin line borders, numbered labels, hand-drawn arrows, local magnification boxes, and summary sections. The overall design should be beautiful, balanced, academic, allowing one to grasp the "structure" and "why" of the concept at a glance.
InfographicMinimalistInk SketchUI ScreenClassroom / StudyElegantCourse MaterialSlide DeckBlog IllustrationText Friendly Area


